Textile Auxiliaries
ISSN 1004-0439, CN 32-1262/TQ
Online First Publication in Textile Auxiliaries
Title: Performance Comparison of Distyryl Benzene Type Fluorescent Whitening Agents
Authors: Zhang Bo, Ji Zhengfang, Ye Liubin, Jiang Hua
Received: March 7, 2025
Online First Publication Date: April 14, 2025
Citation: Zhang Bo, Ji Zhengfang, Ye Liubin, Jiang Hua. Performance Comparison of Distyryl Benzene Type Fluorescent Whitening Agents [J/OL]. Textile Auxiliaries. https://link.cnki.net/urlid/32.1262.TQ.20250414.1208.002
Online First Publication Time: April 14, 2025, 14:58:12
Online First Publication URL: https://link.cnki.net/urlid/32.1262.TQ.20250414.1208.002
Author Information: Zhang Bo (1999–), Female, Master’s degree, Research focus: development and application of high-performance fluorescent whitening agents, E-mail: [email protected].
Corresponding Author: Jiang Hua (1988–), Male, Associate Professor, PhD, Research focus: synthesis and application of high-performance dyes, E-mail: [email protected].
Performance Comparison of Distyryl Benzene Type Fluorescent Whitening Agents
Zhang Bo¹, Ji Zhengfang²,³,⁴, Ye Liubin⁴, Jiang Hua¹,³
(1. Engineering Research Center for Eco-Dyeing and Finishing of Textiles, Ministry of Education, Zhejiang Sci-Tech University, Hangzhou 310018, China; 2. Zhejiang Hongyi Chemical Co. Ltd., Lishui 323700, China; 3. Zhejiang Daoyuan New Material Co. Ltd., Lishui 323700, China; 4. Zhejiang Faster New Material Co. Ltd., Lishui 323700, China)
Abstract: A comparative study was conducted on the structural characteristics, thermal properties, absorption properties, fluorescence properties, and whitening application performance on polyester of three distyryl benzene type fluorescent whitening agents. The study focused on exploring the influence of structural differences on the performance of these fluorescent whitening agents. The results showed that, compared to ER-II, ER-I and ER-III, which possess symmetrical structures, exhibit more regular and ordered molecular arrangements and superior thermal stability. In contrast, ER-II, with relatively higher polarity, not only affects the absorption and fluorescence emission characteristics but also forms a stronger affinity with polyester, which helps enhance dye uptake and dyeing rate.
Keywords: Distyryl benzene; Fluorescent whitening agent; Substituent effect; Polyester; Whiteness
Chinese Library Classification Number: TQ610.495
Document Identification Code: B
In recent years, as the development of new structural whitening agents has slowed, product development in the field of fluorescent whitening agents has gradually shifted towards product blending [1]. Blended whitening agents not only improve the adsorption and dyeing capacity of fibers but also enhance whiteness and reduce the amount of whitening agent used [2-3]. The structural differences of whitening agents used in blending should not be too large, as this may affect the synchronization of the whitening agents’ dyeing of fibers [4]. Among various blending methods, blending fluorescent whitening agents with isomers has become a widely used effective method in the industry [5].
Received: March 7, 2025
Distyryl benzene (ER) type fluorescent whitening agents are an important category of fluorescent whitening agents used for polyester whitening. They are popular in the market due to their low dosage, high whiteness, stable performance, and ease of use [6-7]. This paper selects three commonly used distyryl benzene type fluorescent whitening agents and provides an in-depth analysis of their structural characteristics, thermal properties, absorption properties, and fluorescence properties. After grinding these whitening agents, a high-temperature and high-pressure dyeing method was used to whiten polyester fabric. Parameters such as whiteness, dye uptake rate, and dyeing rate were tested. The structure-activity relationship of these fluorescent whitening agents was systematically discussed to provide useful references for their blended application.
1. Experimental Section
1.1 Materials, Reagents, and Instruments
Materials: Polyester knitted fabric (230 g/m²).
Reagents: Whitening agents ER-I, ER-II, ER-III; defoamer; petroleum ether; ethyl acetate; N,N-dimethylformamide (DMF); toluene; non-ionic dispersing agent (commercially available).
Instruments: TGA550 Thermogravimetric Analyzer (TA Instruments, USA); Q2000 Differential Scanning Calorimeter (TA Instruments, USA); HS82 Melting Point Apparatus (Mettler Toledo, Switzerland); 756S UV-Vis Spectrophotometer (Lingguang Technology Co., Ltd., Shanghai); F-4600 Fluorescence Spectrometer (Hitachi, Japan); RTSM-0.5BJD Horizontal Sand Mill (RUTE Mechanical and Electrical Equipment Co., Ltd., Shanghai); DYE-24 Dyeing Machine (Qianli Automation Equipment Co., Ltd., Shanghai); WSD-3C Whiteness Meter (Kangguang Optical Instruments Co., Ltd., Beijing).
1.2 Theoretical Calculation Method
Density Functional Theory (DFT) calculations were performed using the Gaussian 09 software. The ground-state optimized structures of the whitening agent molecules were obtained at the B3LYP/6-31G basis set level, and the energy information of the whitening agent molecules was further calculated at the B3LYP/6-311++G(d,p) level.
1.3 Whitening Agent Grinding Method
The whitening agent, dispersing agent, and water (mass ratio 2:1:7) were mixed and pre-dispersed using a high-speed disperser (2000 r/min). An appropriate amount of defoamer was added depending on the foaming situation. After 10 minutes, the pre-dispersion was transferred to a horizontal sand mill for grinding, and the dispersion time was recorded. A nanoparticle size analyzer was used to monitor the particle size of the whitening agent in the dispersion. After the grinding process, the slurry was discharged and set aside for further use.
1.4 Polyester Whitening Method
Add the ground whitening agent, water, and fabric (whitening agent dosage x% owf, liquor ratio 1:30) into the dyeing cup. Then place the dyeing cup in the dyeing machine for dyeing and whitening (dyeing temperature 40°C, heating rate 2°C/min, holding temperature 130°C, holding time 60 minutes). After dyeing, cool down to 40°C, remove the sample, wash with water, and air dry.
1.5 Whiteness and Color Parameter Testing Method
Use a whiteness meter to test and record the whiteness value and color parameters of the whitened polyester fabric. Each sample is tested 3 times, and the average value is taken.
1.6 Dyeing Rate Testing Method
Take 1 mL of dye liquor before and after dyeing. Use a UV-Vis spectrophotometer to test the absorption spectra of the dye liquor before and after dyeing, recording the absorbance values at the maximum absorption wavelength. The dyeing rate is calculated using the following formula:
Dyeing rate = (1 − A₂n) × 100%
(1) In the formula, A₁ is the absorbance value of the dye liquor before dyeing, A₂ is the absorbance value of the dye liquor after dyeing, m is the dilution factor of the pre-dyeing liquor, and n is the dilution factor of the post-dyeing liquor.
2. Results and Discussion
2.1 Structural Comparison
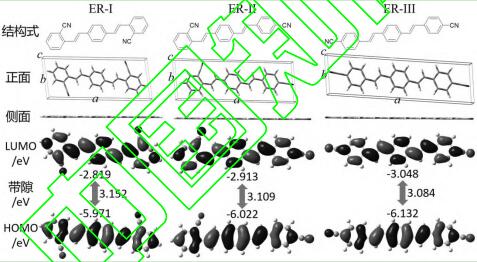
The molecular structure simulation results of the whitening agents ER-I, ER-II, and ER-III are shown in Figure 2 and Table 1. Viewed from the side, the ground-state optimized structures of the three whitening agents are all planar. This is beneficial for enhancing the interaction between the whitening agent molecules and fibers or other substrates, but it also strengthens intermolecular interactions, promoting the aggregation of the whitening agent molecules. The whitening agent molecules are elongated. In the three whitening agent systems studied, as the cyano group gradually moves from the ortho position to the para position, the lattice length of the whitening agent molecules gradually increases, the width decreases, and the height remains almost unchanged. The area of the [ab] plane and the lattice volume are largest for ER-I, followed by ER-II, and smallest for ER-III. Therefore, ER-I has the strongest intermolecular forces, followed by ER-II, and ER-III has the weakest forces.
The position of the cyano group in the ER-type whitening agent molecule has a significant impact on the molecular energy and the frontier orbital energy levels. ER-II has the highest total energy, followed by ER-I, and ER-III has the lowest. This result indicates that ER-III has the most stable structure, while ER-II is the least stable. The electron cloud density of the frontier orbitals of the three whitening agent molecules is uniformly distributed across the entire π-conjugated system of the molecules, and the rich electron cloud density enhances the electrostatic interactions between the whitening agent molecules. The highest occupied molecular orbital (HOMO) energy level decreases gradually from -2.819 eV for ER-I to -3.048 eV for ER-III, and the lowest unoccupied molecular orbital (LUMO) energy level decreases from -5.971 eV for ER-I to -6.132 eV for ER-III. Due to the more significant decrease in the LUMO energy level, the energy gap (∆E = ELUMO − EHOMO) also decreases from 3.152 eV for ER-I to 3.084 eV for ER-III.
The dipole moments of ER-I and ER-III are close to 0, corresponding to the highly symmetric molecular structures of ER-I and ER-III in their ground states. The ER-II molecule exhibits an asymmetric structure, resulting in a dipole moment of 7.4919 debye. The dipole moment of the whitening agent molecule is related to its polarity. As shown in Figure 2, the polarity of the three whitening agents was verified using thin-layer chromatography. Under the same polarity developing agent conditions, ER-I had the highest Rf value (the ratio of the substance's movement distance to the solvent's front movement distance), followed by ER-III, and ER-II had the lowest. Therefore, the polarity ranking of the three whitening agents is ER-I > ER-III > ER-II.
|
Total Energy
|
Dipole moment/debye
|
a/Å
|
b/Å
|
c/Å
|
[ab]/Å2
|
[abc]/Å3
|
|
ER-I
|
-1033.40828
|
0.0002
|
19.1708
|
7.4594
|
1.0001
|
143.0027
|
143.0170
|
|
ER-II
|
-1033.40638
|
7.4919
|
20.9166
|
6.7653
|
1.0048
|
141.5071
|
142.1863
|
|
ER-III
|
-1033.40956
|
0.0003
|
22.3714
|
5.8109
|
1.0024
|
129.9980
|
130.3100
|
Table 1: Molecular Structure Calculation Data of ER-type Whitening Agents
Note: a, b, and c represent the length, width, and height of the molecular lattice, respectively. [ab] refers to the product of the length and width of the molecular lattice, and [abc] refers to the product of the length, width, and height of the molecular lattice.
Note: A mixed solvent of petroleum ether/ethyl acetate in a 5:1 volume ratio was used as the developing agent; observed under a 365 nm light source; the middle point represents the mixed point.

Figure 2: Thin-Layer Chromatography of ER-I to ER-III
2.2 Thermal Properties Comparison
The melting points of ER-I, ER-II, and ER-III were measured using a melting point apparatus. ER-I had a melting point of 224-226°C, ER-II had a melting point of 185-187°C, and ER-III had a melting point of 221-223°C. The melting points of ER-I and ER-III were significantly higher than that of ER-II. This result reflects that compared to ER-II, which has an asymmetric structure, the symmetric structures of ER-I and ER-III allow for more regular and ordered molecular arrangements, requiring higher temperatures to melt.
The thermogravimetric curves (TGA) of ER-I to ER-III are shown in Figure 3(a). Under the tested conditions, the temperatures at which these whitening agents lost 5% of their weight were 311°C, 311°C, and 302°C for ER-I, ER-II, and ER-III, respectively, indicating that all three whitening agents have good thermal stability. The differential scanning calorimetry (DSC) curves of ER-I to ER-III are shown in Figure 3(b). All three whitening agents exhibited two endothermic peaks. The first endothermic peak (at lower temperatures) corresponds to the melting point of each whitening agent, indicating that this peak represents the melting transition of the agents.
The thermal property test results suggest that ER-type whitening agents maintain good thermal stability under high-temperature, high-pressure dyeing processes, heat-melted pad dyeing, or carrier dyeing methods commonly used in dyeing processes. Since the baking temperature in heat-melted pad dyeing can reach 180-200°C, ER-II may undergo phase transformation under these conditions. Therefore, users should be mindful of how such a phase transition may affect the whitening and dyeing performance in practical applications.

(a) Thermogravimetric Curve

(b) DSC Curve
Figure 3: Thermogravimetric and DSC Curves of ER-type Whitening Agents
2.3 Absorption Properties Comparison
The ultraviolet-visible absorption spectra of the three whitening agents in DMF are shown in Figure 4(a). Due to the similar backbone structures of the ER-type whitening agents, they exhibit similar absorption spectra. The maximum absorption wavelengths of ER-I to ER-III in the near ultraviolet range (300-400 nm) were 367, 371, and 367 nm, respectively. ER-II not only showed a red-shifted maximum absorption wavelength but also exhibited a stronger absorption peak at the same concentration. In contrast, in UV-visible absorption spectra in toluene solvent (shown in Figure 4(b)), the maximum absorption wavelengths of all three whitening agents were 367 nm, and the peak shapes were similar. Generally, the absorption mechanism of organic molecules includes n-π* transitions, π-π* transitions, and intramolecular charge transfer. In π-π* transitions, increasing solvent polarity leads to a decrease in excitation state energy, narrowing the energy gap between π and π* orbitals, which results in a red shift of the absorption maximum (λmax). In n-π* transitions, highly polar solvents form hydrogen bonds with the solute's n-electrons, lowering the energy of the n-orbitals and increasing the energy gap between n and π* orbitals, causing a blue shift in λmax. Based on this analysis, the relative red shift observed for ER-II in polar solvents is attributed to its higher polarity. The solvent-enhanced effect on ER-II’s absorption properties also indicates that the absorption spectrum of ER-type whitening agents in the near ultraviolet region is mainly due to π-π* transitions.
Additionally, all three whitening agents exhibited slight absorption in the visible light region (400-420 nm). This accounts for the slight coloration of the agents in powder form, which can reduce the whitening effect when the dosage is too high.
By recording the absorbance values at the maximum absorption wavelength for different concentrations, a standard working curve for the ER-type whitening agents in DMF was obtained. The fitted linear relationship was strong, suggesting that the absorption behavior of ER-type whitening agents at low concentrations follows the Lambert-Beer law. The molar extinction coefficients of ER-I, ER-II, and ER-III were 111.5, 157.3, and 126.3 L/(g·cm), respectively.

(a) Absorption spectrum (in DMF)

(b) Absorption spectrum (in toluene)
(c) Standard Working Curve

(d) Light Exposure Durability Curve
Note: In the standard working curve, the fitted line does not reflect the intercept (the intercept value is less than 0.02).
Figure 4: UV-visible absorption spectra of ER-type whitening agents in DMF (a) and toluene (b), standard working curve (c), and light exposure durability curve (d).
2.4 Fluorescence Properties Comparison
The fluorescence emission and excitation spectra of the three whitening agents in DMF are shown in Figure 5. The fluorescence emission spectra of ER-I to ER-III are located in the range of 390–550 nm, with the maximum emission wavelengths at 431, 436, and 431 nm, respectively. The excitation spectra of ER-I to ER-III range from 290 to 410 nm, largely overlapping with their absorption spectra, with maximum wavelengths at 371, 372, and 371 nm, respectively. Compared to ER-I and ER-III, ER-II shows a red shift in both its emission and excitation spectra, which may lead to some differences in the color appearance of the final whitening product.

(a) Emission Spectrum

(b) Excitation Spectrum
Note: The excitation wavelengths for the emission spectra of ER-I to ER-III are 365, 370, and 366 nm, respectively, and the emission wavelength for the excitation spectrum is 500 nm.
Figure 5: Fluorescence emission spectra (a) and excitation spectra (b) of ER-I to ER-III.
2.5 Grinding Properties Comparison
The variation curve of the average particle size of the whitening agents with grinding time is shown in Figure 6. The grinding process of the whitening agents can be divided into three stages: a rapid particle size reduction stage (stage 1), a slow particle size reduction stage (stage 2), and a particle size stabilization stage (stage 3). In the first stage, due to the action of the grinding media (zirconium beads), large solid particles of the whitening agents are rapidly broken down into fine particles during collisions. The average particle size of the whitening agent in powder form is approximately 70–80 μm. By the time the grinding process reaches 100 minutes, the particle size of the whitening agent has been reduced to 1–3 μm. In the second stage, the particles of the whitening agent become noticeably smaller. At this point, it becomes more difficult to disperse the whitening agent particles and further reduce their size, so the rate of particle size reduction slows down. The particle size variation curve reflects the ease of depolymerization of the whitening agent particles as ER-I > ER-II > ER-III. For instance, to achieve an average particle size of 1 μm, ER-I requires approximately 240 minutes, ER-II needs about 180 minutes, and ER-III only takes about 90 minutes. This result can be explained by comparing the molecular structures. From ER-I to ER-III, the area of the molecular [ab] plane gradually decreases, and the intermolecular forces weaken, making it easier to depolymerize the larger particles of the whitening agents. The particle size variation curves of the three whitening agents intersect at approximately 360 minutes, where the particle size is about 0.55 μm. In the third stage of grinding, the whitening agent particles basically reach a balance between depolymerization and aggregation, and the particle size variation becomes less noticeable. However, the particle size of ER-I still shows a gradual decreasing trend, while the particle size reduction trend for ER-II and ER-III becomes less evident. This may be due to the larger molecular plane of ER-I, which interacts more strongly with the dispersing agent compared to ER-II and ER-III, better inhibiting the self-aggregation of ER-I molecules and promoting the further reduction of ER-I particle size.

Figure 6: Particle size variation curve with grinding time.
2.6 Whitening Effect Comparison
The three types of whitening agents, after grinding treatment, were used for whitening polyester fabrics through high-temperature and high-pressure dyeing methods. The color parameters and whiteness values of the dyed polyester fabrics are shown in Table 2. Compared to the original polyester fabric, the polyester fabric treated with ER-type whitening agents exhibited a significant improvement in whiteness. For example, when using 0.05% owf of ER-I, the whiteness value of the polyester fabric increased significantly from 70.65 (original fabric) to 83.43 (treated fabric), and the b* value (yellow-blue coordinate) changed from 0.64 to -9.26. The yellowing point (the amount of whitening agent at which the whiteness no longer increases) for ER-I is approximately 0.2% owf, where the fabric whiteness is 91.52. The yellowing point for ER-II is approximately 0.2% owf, corresponding to a whiteness value of 93.28. The yellowing point for ER-III is around 0.15% owf, with a corresponding whiteness value of 91.99. When the whitening agent is used above the yellowing point, the absolute value of the b* value of the polyester fabric increases but then significantly decreases. The L* value and whiteness significantly decrease above the yellowing point. This is due to the aggregation-induced fluorescence quenching of the excessive whitening agents and the inherent yellowing of the whitening agents themselves.
Table 2: Color parameters and whiteness values of polyester fabric treated with ER-type whitening agents.
|
Brightener
|
Dosage/%owf 1
|
L*
|
a*
|
b*
|
Whiteness 2
|
|
 Original cloth (control sample) Original cloth (control sample)
|
87.37
|
2.19
|
0.64
|
70.65
|
|
ER-I
|
0.05
|
87.59
|
4.90
|
-9.26
|
83.43
|
|
0.1
|
90.57
|
4.22
|
-8.77
|
89.70
|
|
0.15
|
89.33
|
5.14
|
-9.19
|
87.35
|
|
0.2
|
90.84
|
4.68
|
-9.61
|
91.52
|
|
0.4
|
85.98
|
5.20
|
-12.76
|
84.39
|
|
0.6
|
86.83
|
4.57
|
-12.45
|
86.05
|
|
0.8
|
84.66
|
3.01
|
-12.08
|
80.54
|
|
1.0
|
88.47
|
3.81
|
-8.70
|
84.69
|
|
ER-II
|
0.05
|
90.51
|
3.80
|
-8.39
|
89.03
|
|
0.1
|
88.87
|
3.96
|
-7.67
|
84.50
|
|
0.15
|
89.81
|
4.36
|
-10.34
|
90.04
|
|
0.2
|
91.36
|
3.86
|
-9.98
|
93.28
|
|
0.4
|
89.31
|
5.97
|
-10.69
|
89.33
|
|
0.6
|
86.75
|
4.11
|
-11.46
|
84.44
|
|
0.8
|
87.93
|
4.59
|
-9.96
|
85.14
|
|
1.0
|
89.38
|
3.32
|
-8.97
|
87.16
|
|
ER-III
|
0.05
|
90.17
|
3.97
|
-9.32
|
89.49
|
|
|
0.1
|
90.94
|
3.36
|
-8.65
|
90.40
|
|
0.15
|
91.84
|
2.83
|
-8.23
|
91.99
|
|
0.2
|
89.63
|
4.71
|
-9.79
|
88.86
|
|
0.4
|
88.66
|
3.75
|
-7.64
|
83.73
|
|
0.6
|
88.43
|
2.50
|
-5.86
|
83.48
|
|
0.8
|
89.64
|
2.66
|
-5.23
|
84.15
|
|
1.0
|
90.77
|
1.91
|
-4.97
|
85.51
|
Note 1: Relative to the original powder; Note 2: Blue light whiteness.
The dye uptake data for the polyester fabric treated with whitening agents are shown in Figure 7. When the whitening agent dosage does not exceed 0.8% owf, the dye uptake rate for ER-I is greater than 95%. At a dosage of 1% owf, the dye uptake rate for ER-I slightly decreases to 81%. ER-II maintains a very high dye uptake rate for dosages not exceeding 1% owf. For ER-III, the dye uptake rate significantly decreases when the dosage exceeds 0.4% owf. These results indicate that ER-II has the best affinity with polyester, followed by ER-I, and ER-III has the weakest affinity. The greater polarity of ER-II is likely the primary reason for its enhanced affinity with polyester. ER-III has not only a large difference in polarity with polyester but also insufficient molecular plane area for interaction with the fiber, which leads to its weaker affinity with the fiber.

Figure 7: Dye uptake rate for polyester treated with different dosages of ER-I to ER-III.
At a dosage of 0.2% owf, the temperature dyeing rate curves of the whitening agents for polyester were recorded, as shown in Figure 8. Compared to ER-I and ER-III, the temperature dyeing curve for ER-II is generally shifted to the left, indicating that ER-II has a faster dyeing rate. ER-II adsorbs some whitening agent molecules onto the polyester fiber at temperatures below 100°C, then dyes rapidly in the temperature range of 100–130°C, achieving complete dyeing when the temperature reaches 130°C. Both ER-I and ER-III adsorb fewer molecules at lower temperatures, and they still require a period of time at 130°C to achieve complete dyeing. These results again indicate that, compared to ER-I and ER-III, ER-II has a higher affinity with polyester.

Figure 8: Dyeing rate curves for ER-I to ER-III.
3. Conclusion
The changes in the position of the cyano group in the molecular structure of the diphenylethene-based fluorescent whitening agents mainly alter the spatial shape, molecular polarity, and charge distribution of the molecules, which in turn affects the intermolecular interactions as well as the interactions between the whitening agent molecules and the fiber macromolecules. These changes have a significant impact on the thermal properties, absorption and emission properties, and application performance of the whitening agents. Compared to ER-I and ER-III, ER-II has an asymmetric molecular structure with greater molecular polarity, leading to stronger affinity with the fiber. Under similar conditions, ER-II exhibits higher dye uptake, faster dyeing rate, and higher whiteness values of dyed polyester fabrics.
References:
[1] Zhang Jie. "Technological Advances of Fluorescent Whitening Agents and Their Environmental Impact (Part 4)." Printing and Dyeing, 2015, 19: 49-52.
[2] Wang Xiaoying, Wang Xiaolin. "Whitening Methods for Polyester and Fluorescent Whitening Agents." Dyeing and Dyeing, 2019, 56(4): 33-36.
[3] Gan Hongyu, Wang Gang, Ji Dongfeng. "Application of Fluorescent Quantum Yield in the Compatibility and Quality Control of Fluorescent Whitening Agents." Printing and Dyeing Auxiliaries, 2016, 33(11): 57-60.
[4] Guo Lixue, Wang Chenglong, Huang Junfeng, et al. "Analysis of the Performance of the High Lightfastness Dyes C.I. Disperse Blue 77 and C.I. Disperse Yellow 54." Journal of Zhejiang Sci-Tech University, 2023, 49(4): 466-475.
[5] Zhu Baijun, Cheng Yi, Cheng Dewen. "Diphenylethene-Based Fluorescent Whitening Agents." Printing and Dyeing Auxiliaries, 2006, 23(2): 15-18.
[6] Liang Xiaoyan, Huo Jingpei, Hu Xiaohong, et al. "Research Progress on Diphenylethene-Based Fluorescent Whitening Agents." Chemical Propellants and Polymer Materials, 2018, 16(2): 14-20.
[7] Xu Huizhi, Yu Weigang, Jiang Zhiqian. "Synthesis of Cyanogroup Substituted Diphenylethene-Based Asymmetric Fluorescent Whitening Agents." Dyeing and Dyeing, 2014, 51(2): 11-13.
 EN
EN 中文
中文 ES
ES


.jpg)